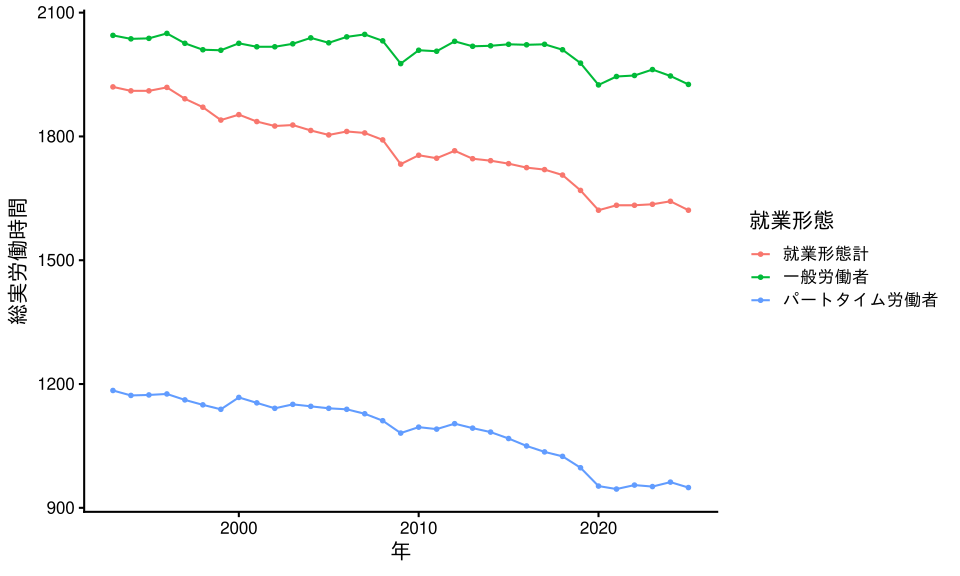
労働時間の推移
毎月勤労統計の長期時系列表を使って,就業形態別に総実労働時間数の推移をグラフにする。
コード
## ---- setup ----

library(tidyverse)

## ---- data ----
# ファイルのダウンロード先ディレクトリ作成
dir.create("files", showWarnings = FALSE)

# 毎月勤労統計調査  長期時系列表  実数・指数累積データ
# 表番号1 実数・指数累積データ 実数

url <- "https://www.e-stat.go.jp/stat-search/file-download?statInfId=000032189776&fileKind=1"
file_name <- "files/hon-maikin-k-jissu.csv"

if (!file.exists(file_name)) {
  download.file(
    url,
    destfile = file_name,
    method = "curl"
  )
}

maikin <- read.csv(
  file_name,
  fileEncoding = "shift-jis"
) |>
  filter(
    `年` >= 1993 &
      `月` == "CY" &
      substr(`産業分類`, 1, 2) == "TL" &
      `規模` == "T"
  )

## ---- plot ----
w_status <- c("就業形態計", "一般労働者", "パートタイム労働者")

graph_hours <- maikin |>
  mutate(`総実労働時間` = `総実労働時間` * 12) |>
  ggplot(
    aes(
      x = `年`,
      y = `総実労働時間`,
      color = as.factor(`就業形態`)
    )
  ) +
  geom_line() +
  geom_point(size = 1) +
  scale_color_hue(
    name = "就業形態",
    labels = w_status
  ) +
  theme_classic(base_size = 16)

plot(graph_hours)